


Similar Destinations to Fayetteville
If you enjoy the weather, attractions and the things to do in Fayetteville, check out these comparable destinations as potential alternatives.
Things to Do in Montgomery, AL: Your Ultimate Guide to the Capital City Attractions, AL
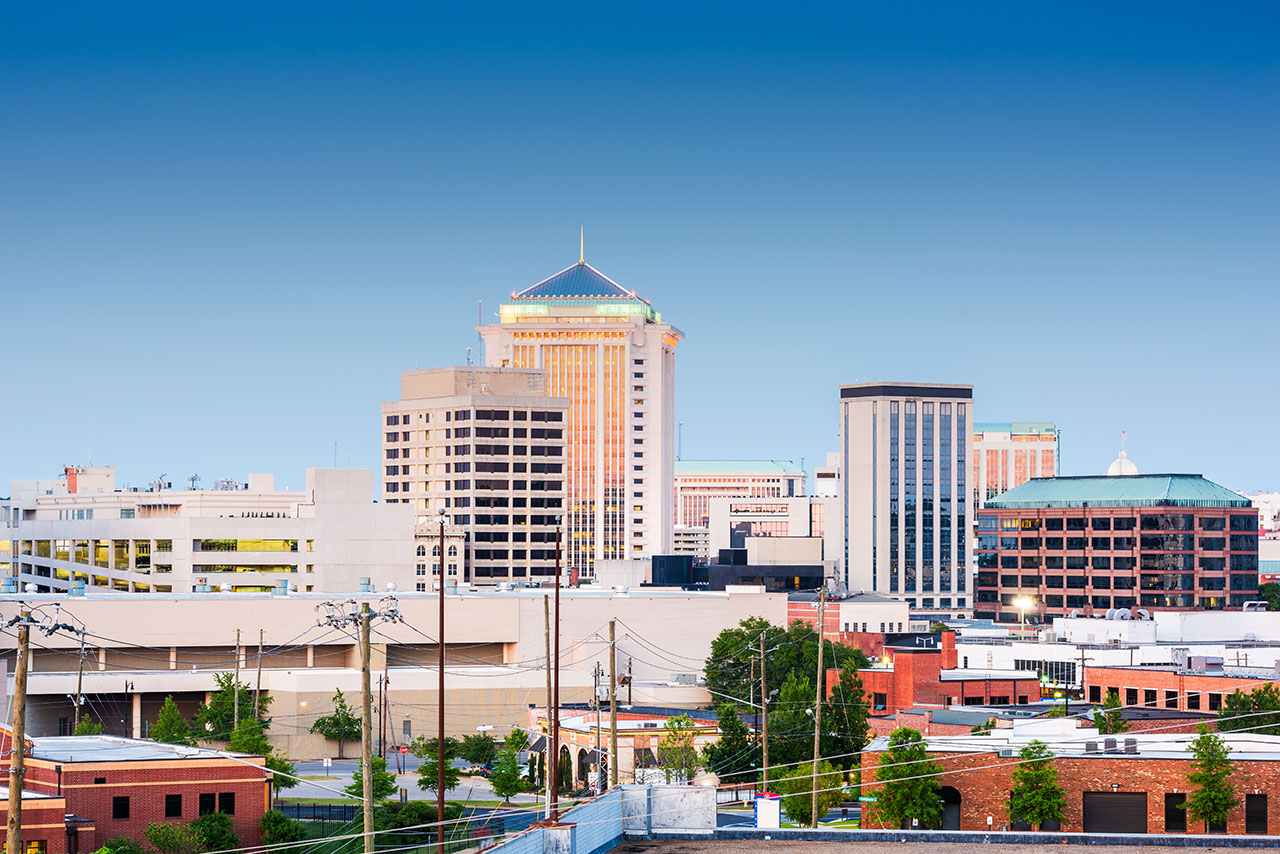
As Alabama’s capital, Montgomery lies on the Alabama River and offers multiple sightseeing opportunities, such as the Montgomery zoo and… Read More
Newport News, VA
Anyone interested in learning about US history needs to plan a trip to Newport News right now. The city has a number of historical gems,… Read More
Jackson, MS

Being one of the central cities of the historic Civil Rights movement, Jackson is the most populated city in Mississippi and understandably… Read More
Murfreesboro, TN
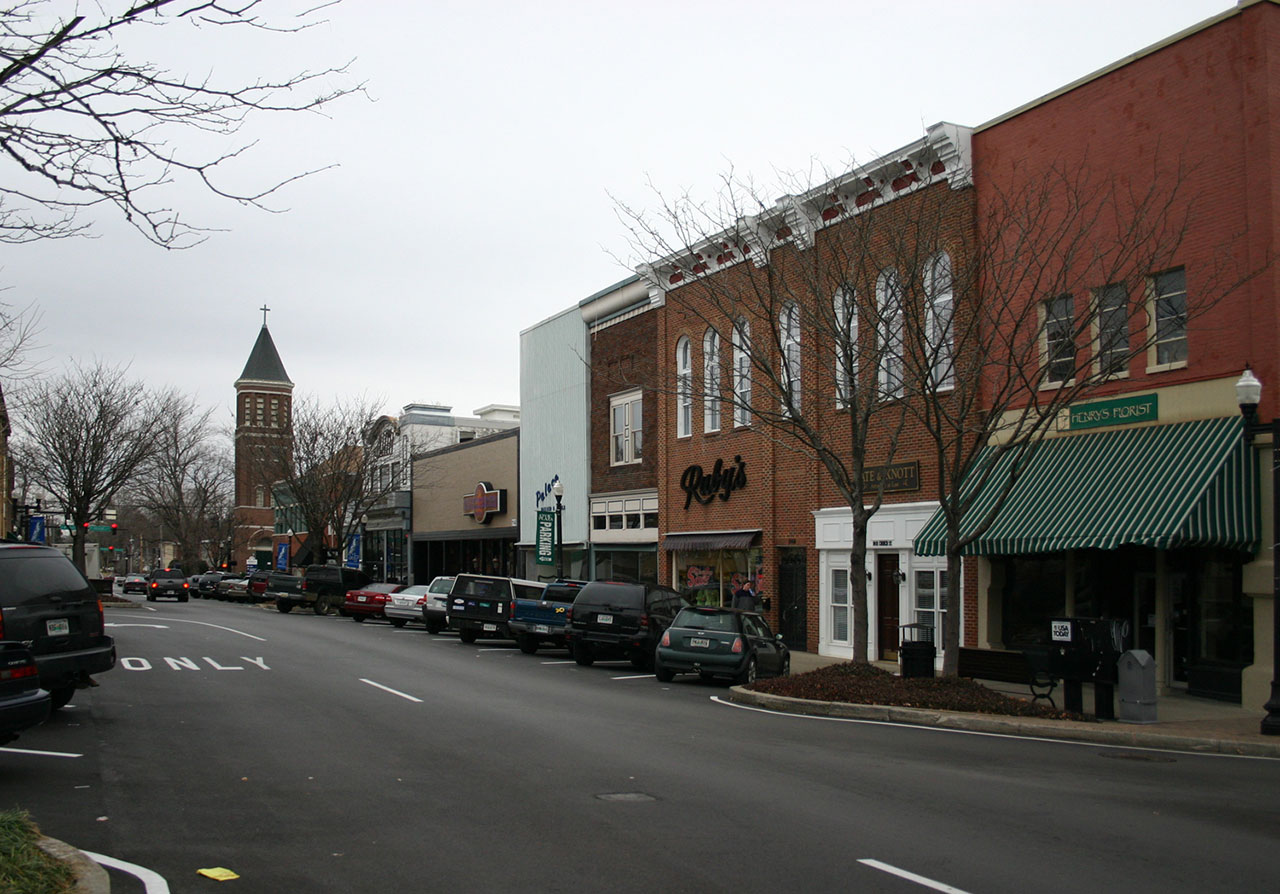
If we start naming all attractions in Murfreesboro, it will take a few hours, to say the least. Although not having any fame on the national… Read More
Waco, TX
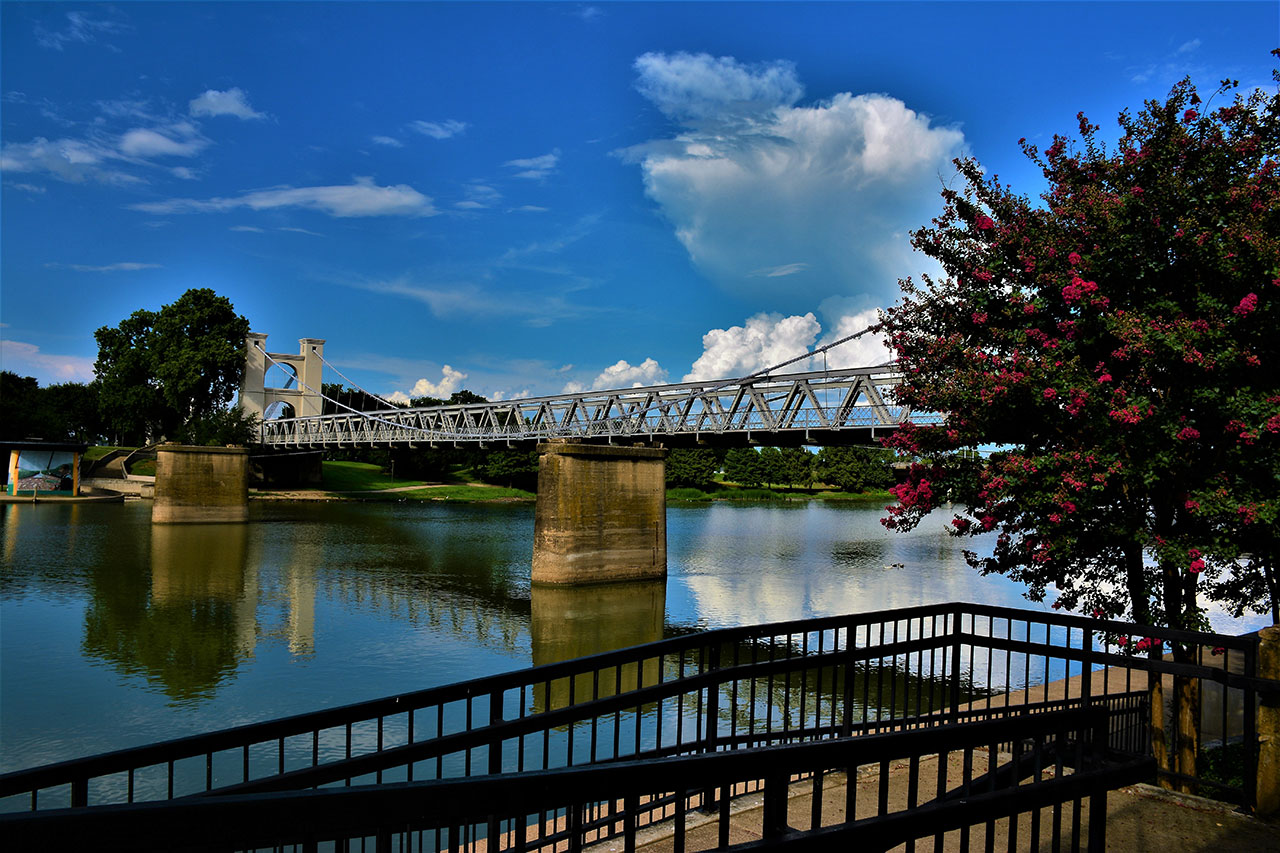
Waco, despite being an average-sized city, has a surprisingly large number of things to offer, owing to its closeness to the Brazos River.… Read More


